Curshaw React to the 10 Year Infrastructure Strategy
Exec Summary
The UK faces significant infrastructure challenges, including a £49bn government property maintenance backlog and persistently low government investment (2.5% of GDP since 2000), contributing to weak productivity.
Key parts of the strategy:
£725bn committed over 10 years (public and private).
Heavily weighted towards new capital stock (roughly 2/3 of total).
Energy and defence are the largest beneficiaries (over £100bn each).
Vast majority of funding front-loaded (over 2/3 by 2029/30).
Over 80% for publicly owned infrastructure, with >£100bn from private investment.
Analysis:
Maintenance vs New Assets: Health sector funding disproportionately allocated to existing issues (over 2/3), raising questions about sufficiency without a new NHS strategy. New PPPs in primary care might fill some gaps.
Funding Period: Though a "10-year plan," most spending is within this parliament, potentially impacting supporting industries' confidence post-2030.
Public vs Private: Including private spending on private assets in a "public pipeline" could inflate perceived public commitment.
Implications
Commitment to new assets at scale, credible project pipeline, and return to government provision in neglected sectors (e.g., housing).
The £725bn may be insufficient to address the UK's estimated £2 trillion investment gap.
Lack of adequate data and needs assessment (e.g., true maintenance backlog could be higher, long-term social infrastructure assessment not until 2035) reduces confidence in pipeline adequacy.
A positive step to re-centre infrastructure, but time will tell if the commitment is sufficient to reinvigorate the UK's economic future.
Where were we?
Prior to the release of the Government’s 10 Year Strategy, the infrastructure challenges facing the UK were no secret. As of October 2024, the maintenance backlog of government properties had reached at least £49bn, marking the serious decline faced by parts of the public estate, especially in the period since 2008.
This statistic is both emblematic of and a contributing factor to the more broadly challenging economic circumstances that Britain is experiencing. Since 2000, government investment has made up just 2.5% of GDP - ⅔ of the OECD average. Although there are many theories as to why the UK has suffered from persistently low growth in the period since the GFC, it is undoubtedly true that this has stemmed in part from significantly weakened productivity growth.
In 2019, the UK lagged its peers in the US, Germany and France value in added per hour by 28%, 13% and 14% respectively, mostly due to a lack of capital investment. Whilst this issue is not purely restricted to the public sector, there is no doubt that the lack of investment has significantly hampered its capacity and effectiveness. In addition to the direct effects on productivity and growth, this has also severely affected the ability of vital public services to effectively support the broader economy.
Clearly, bold action is required to reinvigorate both public and private sector investment, to drive productivity and overall economic growth. Infrastructure has consistently demonstrated its ability to provide a strong multiplier. As noted by the World Bank, Public investment in infrastructure generally provides a fiscal multiplier of 0.8 within 1 year and around 1.5 within 2-5 years. This effect was found to be higher than that of public spending as a whole and, critically, is higher during contractionary economic cycles.
Clearly, the government’s declared intention to ‘rebuild Britain’ is well-founded on sound logic. The key question: Has it gone far enough?
What are the key parts of the strategy?
The newly published 10 year Infrastructure Strategy has committed to a pipeline worth at least £725bn of Infrastructure spending through a mix of public and private sources.
This is heavily weighted towards building new capital stock although there are also extensive funds dedicated to maintaining and repairing existing assets. Roughly ⅔ of the overall settlement is intended to construct new infrastructure. This varies by sector however. Energy and defence are the overall winners. Both sectors are set to receive over £100bn.
The vast majority of the funding is forecast to be spent within this parliament. Again, over ⅔ is likely to be spent by 2029/30, even when employing conservative assumptions for projects that currently lacking clear time frames.
Over 80% of the assets in strategy aim to use public funds to invest in publicly owned infrastructure. C. >£100bn of the pipeline is constituted of private Investment i.e. committed infra spend by Vodafone3 following their merger).
What are the implications?
Maintenance vs New Assets
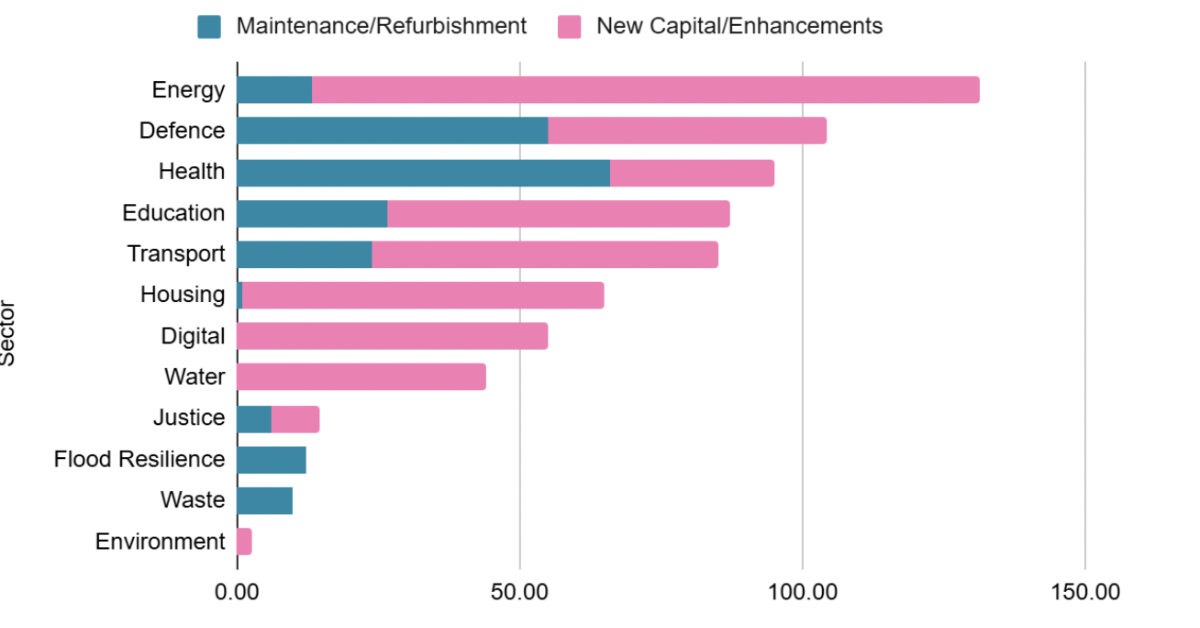
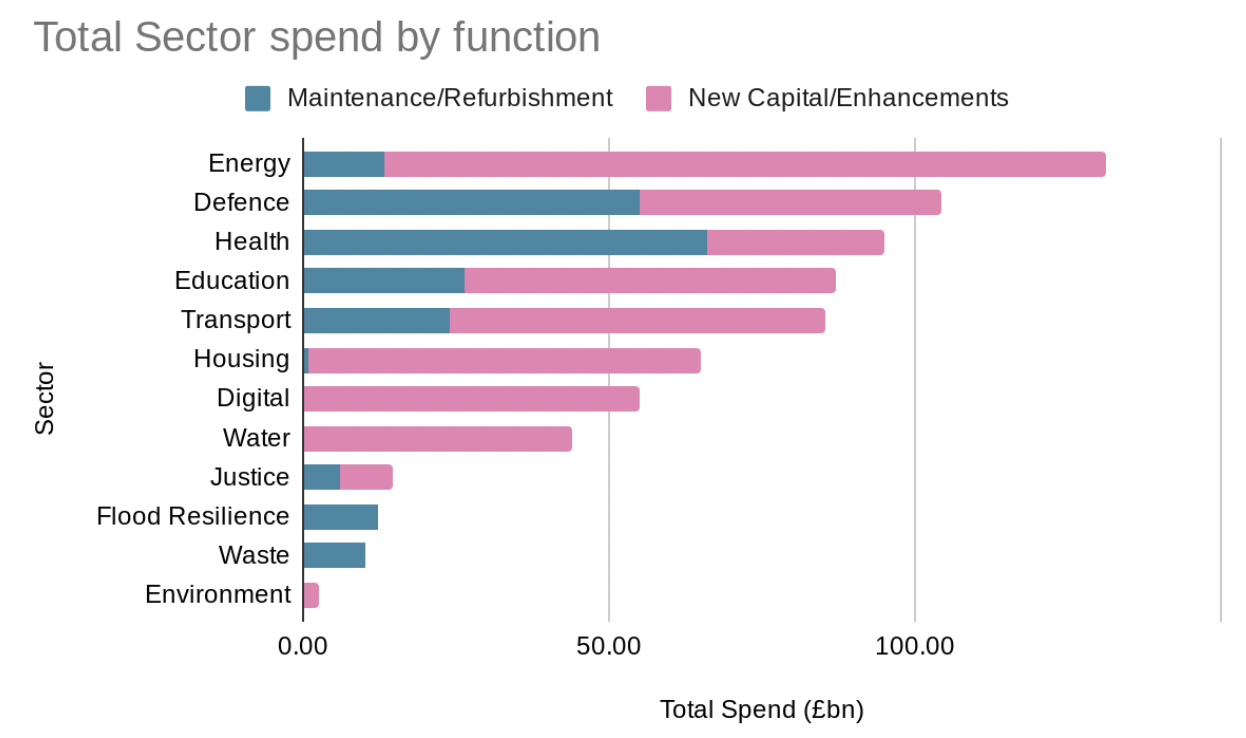
Whilst the heavy weighting towards new assets is welcome, when this is broken down by sector (see Figure 1) some questions do emerge. In particular, the Health Sector is of interest where the pattern of new investment flips. Over ⅔ of the total is mostly allocated to remedying existing issues in the estate.
Without the additional context of the new NHS strategy it is hard to fully judge this. In the event that the government is seeking to deliver the NHS’s needs through a revamp of existing secondary care assets buttressed by a new generation of primary healthcare infrastructure alongside more general interventions to promote preventative rather than reactive care, this may be sufficient. It is worth noting however that the majority of new capital stock funding (£24bn) here is allocated to the New Hospitals programme, much of which is scheduled to become operational well into the 2030s and which is definitively secondary care.
The Infrastructure strategy does leave the door open to a new generation of PPPs, ending the 2018 moratorium and announcing an intention to explore primary care in particular. It may be that this is used to fill the gap that seemingly exists above. This is before any assessment of broader UK needs is considered.
Figure 1. Total Spend by Function and Maintenance vs New Assets
Funding period
Whilst the government has indicated that this is a 10 year plan, as elaborated above, a closer examination (albeit with assumptions and in the absence of the soon to be published pipeline) indicates that this is rather a plan mostly for this parliament. See Figure 2 for the profile.
Whilst the urgency to deliver this is commendable, and it is understandable that plans become less certain as the temporal horizon expands, it is questionable whether supporting industries will examine this pipeline and feel confident to fully commit to supporting it, especially as the funding curve drops off post-2030.
Figure 2. Total Spend by Year

Public vs Private
As noted above, the infrastructure strategy is heavily weighted towards public assets, with a smattering of private investment added on top. Although counting investments in regulated industries i.e. investment by water utilities seems valid, it is questionable the extent to which private spending on private assets should be incorporated into a public pipeline.
The intention to fully unify all UK infrastructure spend for accurate analysis by the contracting market makes sense. This private figure should not however be used to imply greater public spending than is otherwise being deployed however. This is critical to accurately consider the needs set against ability to meet this.
Where does this leave us?
Although the 10 year strategy is a serious step in the right direction. The strategy has created several needed ingredients including;
A commitment to building new assets at scale.
A credible pipeline of projects that aims to depoliticise infrastructure and manage it on the lengthy cycles required.
A return to government provision of previously neglected sectors i.e. housing.
Concerns remain however.
As noted by PwC recently, ‘in cumulative terms’ the UK may be contending with an investment gap in excess of £2 trillion since the financial crisis. Although £725bn is a commendable commitment, it may be some way off the level of investment needed to totally address the issue. It is worth nothing that this figure would simply place the UK on an equal footing to its peers. To develop truly world leading infrastructure may require spending well in excess of this. It remains possible that this £725bn may be complemented by similar increases in private investment generated by the increased stability. There is a significant disparity nonetheless.
This is further compounded by a lack of adequate data and associated needs assessment.
The recent condition of Government Property report identified the maintenance backlog of £49bn reported above. When this issue is considered more closely though, the true figure may be far larger. The Office of Government Property currently lacks data on the condition of 36% of central government property. Much of this untracked property is also feared to be in the worst condition. The OGP estimates that the true cost of full remediation could be significantly higher than is currently known.
The Infrastructure Strategy also implies that a full assessment of actual need, at least for social infrastructure has not taken place. One identified issue for social infrastructure in the strategy is the ‘lack of a long-term needs assessment for social infrastructure’. The timeline included to address this includes recommendations on needs from NISTA in 2027, initial implementation work in 2030 and finally establishment of ‘clear prioritisation of infrastructure investment’ in 2035. There is no clear indication of what the allocation of funds for social infrastructure has been based on in the latest strategy.
Simply put, the information above reduces overall confidence in the adequacy of the pipeline to fully address the situation. We do not fully know how large the problem is, and have not begun to assess the extent of the need in other areas. In the event that this is the opening salvo in a much longer plan, this may be sufficient but at this current stage this remains unclear.
In conclusion, there are many commendable aspects of the strategy, placing infrastructure on the requisite political footing and centering it as the driving force of the economy is vital and welcomed. Time will tell whether the government and the country have the commitment to deliver a large enough and stable enough pipeline to reinvigorate the economic future of the United Kingdom.
If you are interested in how to start handback the right way and in how Curshaw has successfully facilitated joint handback workshops and plans on an independent and joint appointment basis that is designed to deliver efficient, effective and equitable outcomes then speak to us.