The Reshaping of the UK MSP Market
For the past two to three decades, Management Services Providers (MSPs) have been able to rely on a steady stream of revenues through operational PFI projects. Responsible for overseeing day-to-day contract management of infrastructure projects on behalf of SPVs, the decline in the number of operating PFIs as a result of expiries will see them face a sharp contraction in their addressable market. Annual payments to PFI Project Companies peaked at £10.69 billion in FY2025, and will decline steadily from this point onwards as the rate of expiries picks up over the next decade.
However, the expiry wave will not arrive evenly; both the rate and scale of decline varies rapidly between the eight largest MSPs in the UK. Using the recently published 2025 NISTA data-set, we have used an API with Companies House to link each PFI Project Company to its MSP across all 654 active projects. The result is a level of detail that does not exist in the original public data.
The 654 active PFI projects have approximately £117 billion of Unitary Charge Payments (UCP) still to be paid out from FY27 onwards. At a 5% MSP fee assumption, that is an addressable MSP fee pool of around £5.85 billion over the remaining life of operational PFIs.
Compared to other MSPs, Vercity clearly has the highest market share due to its involvement in major health projects. Equitix Management Services (EMS), meanwhile, has the highest number of projects, but a lower overall value per project.

The UK PFI market is shrinking
Of the 654 active PFI projects, 152 will expire by the end of FY30, leading to a decreased MSP fee pool. The charts below illustrate the extent of this decline in five-year increments, with each pie being proportionate to the first. Comparing the FY27 to FY31 period against the FY32 to FY36 period, total MSP revenues drop by 20.5%. The period after that sees a further 41% reduction. By the time the FY42 to FY46 window arrives, the market is essentially down to a handful of long-dated hospital contracts and a residual tail of payments.
UK PFI MSP Market Share
Projected revenue by five-year period · values in £m · pie area scales with total market size
Hover over a slice for detail · use the buttons to select time period
The reduction is relatively front-loaded, with roughly half of the portfolio expiring between 2032 and 2037. The drop-off in revenues is likewise steep, as most remaining UCP will be paid out by 2033.
This revenue chart further demonstrates that the MSP market is not only reducing, but reducing unevenly between MSPs. Meanwhile, Vercity’s involvement on major hospital projects, overseeing the longest-lasting PFIs, some lasting throughout the 2040s, explains why their share of total UCP will grow from 15% in 2026 to 55% in 2041, even as the market value shrinks by 79% during this period.
Estimated Annual Revenue to MSP from UK PFI
By financial year · click a legend entry to mute/show · Values in £100k
A shrinking UK PFI market could lead to more aggressive competition
By the end of FY31, the number of operational PFIs will have fallen considerably.
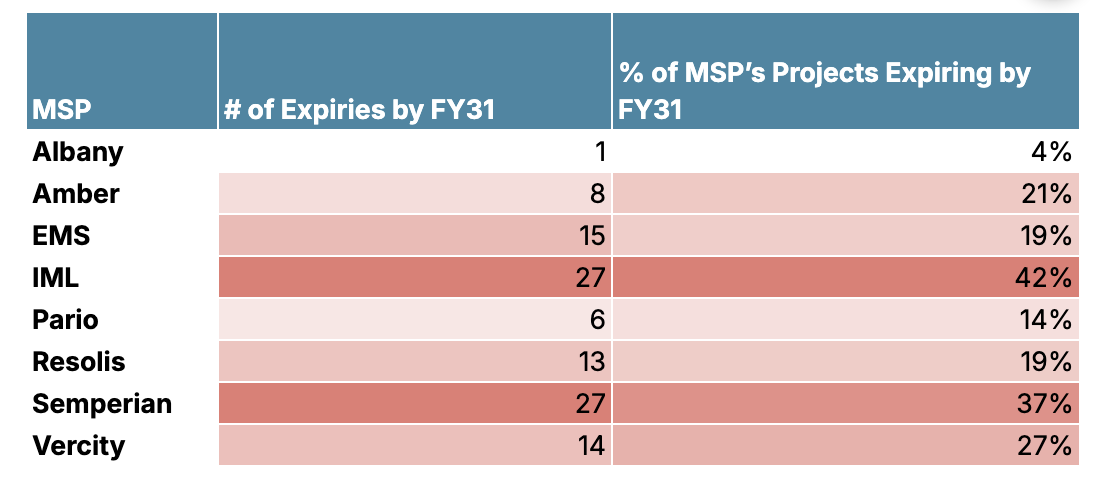
Semperian and IML are facing a near-term cliff, with both seeing more than a third of their current project count expire within five years. Albany, in contrast, has the longest-dated book of any of the eight, and is barely touched over the same five year period. Vercity is insulated by its concentration in long-dated hospital contracts that run into the mid-2040s.
The lack of new PFI contracts means that the shape of the future market is already locked in by the maturity profile of today's contracts - these figures assume that contracts do not switch hands between MSPs before expiring.
The MSP market has not, historically, been highly competitive, as there has been limited incentives to aggressively bid and take over other contracts, but with the decline in volume and value of work it is possible that MSPs will be faced with stranded labour unless staff losses through attrition are not managed in lockstep. Faced with the risk of stranded labour and a shrinking market it is possible that there will be MSP consolidation or increased market competition.
Conclusion
In the next 5 years, as a result of the handback wave and the moratorium on PFI in 2018, the MSP market will change profoundly. This will have implications for the MSPs and those who rely on them, both SPVs and contracting authorities, and may present uncertainty for a workforce that has been responsible for managing state critical infrastructure and supply chains with pride for years and years. It is unclear how this human capital will be managed and how organisations will rightsize to reflect the changing value of the market. Much will depend on TUPE and the post-PFI operating models designed and procured by contracting authorities. This makes it ever so important for joint handback planning to happen as early as possible and as part of that, for parties to consider key-personnel risk and the labour loading of both the handback work and the post-PFI target operating model.
Notes on the data
Our analysis maps 76% of the 654 active PFI projects to an MSP (68% to one of the main 8 MSPs, and 8% to 11 smaller participants). The remaining 24% sit in an unattributed bucket. Some of these may belong to one of the eight. Others are managed by smaller or in-house arrangements. The shares quoted above are therefore conservative for the named MSPs.
The 5% MSP fee assumption is also a flat proxy. Fees vary by sector, contract complexity, and the bundle of services provided. Refinement here may improve the accuracy of figures.